
Introduction
As rack densities rise and workloads become more volatile, a power distribution unit is no longer just a delivery point for electricity; it is a source of operational intelligence. AI-powered analytics turns PDU telemetry into actionable insight by revealing real-time consumption patterns, identifying overload and thermal risks, and exposing unused capacity that traditional monitoring often misses. This article explains how that data is collected, what machine learning can infer from it, and why these capabilities matter for improving uptime, planning capacity, and operating data center power infrastructure more efficiently.
How AI-powered analytics is changing PDU strategy
The modern data center is undergoing a fundamental transformation driven by escalating power densities and the integration of artificial intelligence into facility management. As rack densities push past the traditional 5 to 10 kW thresholds into the 40 to 50 kW range—necessitated by high-performance computing and GPU-intensive workloads—legacy power management strategies are proving inadequate. Facility operators can no longer rely on reactive monitoring or manual capacity audits to ensure uptime and efficiency. Instead, they are turning to AI-powered analytics to transform static infrastructure into dynamic, self-optimizing ecosystems.
At the core of this transition is the evolution of the power distribution unit. No longer just a sophisticated power strip, the modern unit acts as a critical edge computing node, capturing high-fidelity electrical data at the receptacle level. When this telemetry is ingested by machine learning algorithms, operators gain unprecedented visibility into power consumption patterns, thermal risks, and stranded capacity. This shift from descriptive reporting to predictive analytics enables data center managers to maximize existing power infrastructure, delay costly capital expenditures, and maintain stringent service level agreements (SLAs) under increasingly volatile load conditions.
Why PDU telemetry matters for power management
The fundamental requirement for advanced power management lies in continuous, granular telemetry. Without real-time data from the rack level, data centers typically operate with 15% to 20% stranded capacity—power that is provisioned but never utilized due to conservative safety margins and static threshold planning. Telemetry provides the empirical foundation required to safely reclaim this stranded power, allowing facilities to deploy additional IT equipment without upgrading upstream UPS or generator infrastructure.
Furthermore, high-resolution telemetry is vital for maintaining phase balance and preventing localized circuit overloads. In high-density environments, an unbalanced three-phase load can quickly lead to tripped breakers and cascading failures. By monitoring a power distribution unit PDU at intervals of one second or less, operators capture micro-fluctuations in current and voltage that indicate impending issues. This level of visibility transforms power management from a periodic auditing exercise into a continuous, data-driven operational discipline.
How AI turns raw PDU data into operational insight
Raw electrical data, while necessary, is insufficient on its own; the sheer volume of telemetry generated by thousands of rack PDUs quickly overwhelms human operators and traditional threshold-based alerting systems. Artificial intelligence bridges this gap by applying advanced pattern recognition and time-series forecasting to massive datasets. Where a legacy system might trigger an alarm only when a circuit exceeds 80% capacity, an AI model establishes baseline behavioral profiles for individual servers and racks, identifying subtle deviations that precede hardware degradation.
These machine learning models evaluate variables across multiple dimensions, correlating power draw with time of day, workload scheduling, and historical utilization rates. By processing this telemetry, AI algorithms can achieve anomaly detection accuracy rates exceeding 95%, drastically reducing alarm fatigue caused by false positives. The operational insight generated allows facility teams to transition from reactive firefighting to proactive maintenance, scheduling power supply replacements or workload migrations weeks before a critical failure occurs.
What data teams should capture from PDUs
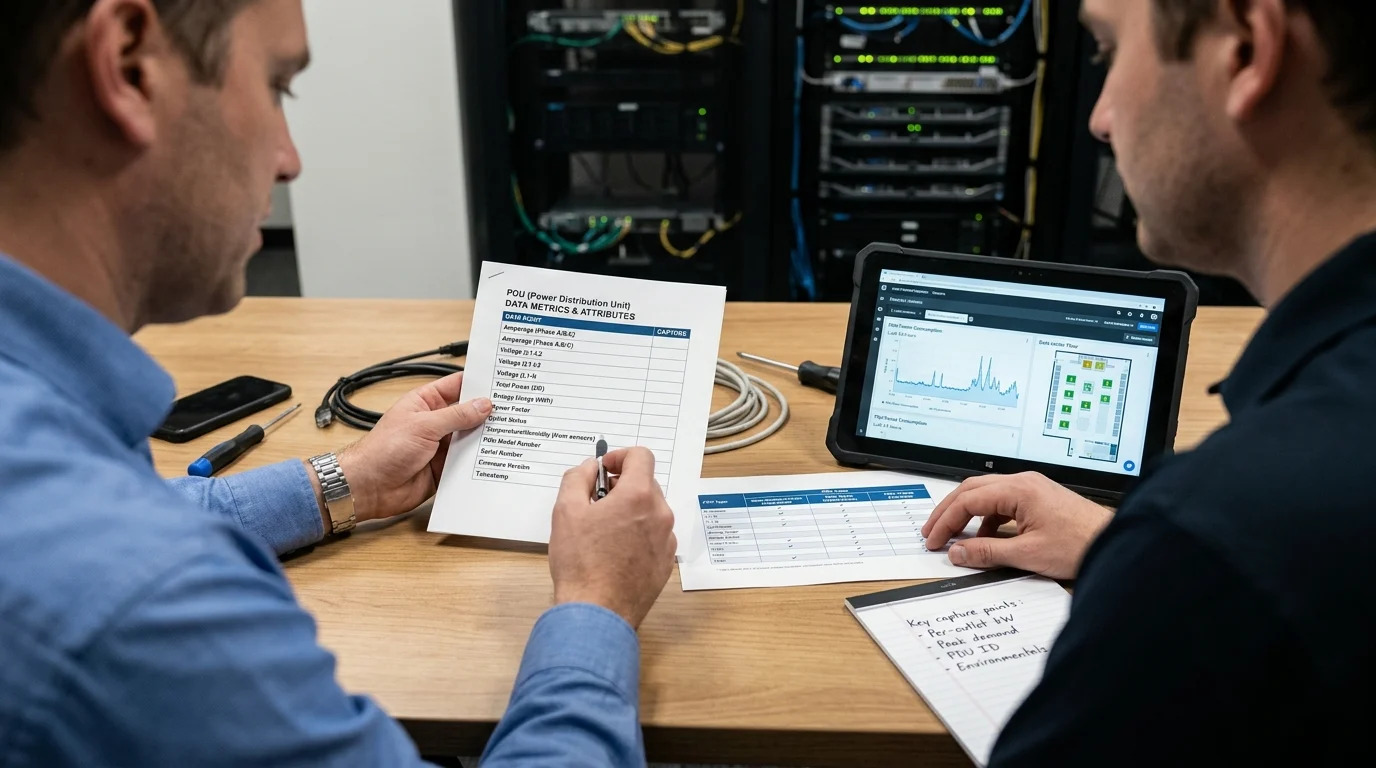
To fuel accurate machine learning models, data science and facility management teams must establish a robust telemetry foundation. The efficacy of any AI-powered analytics initiative is directly proportional to the quality, resolution, and relevance of the data ingested. Capturing the right parameters at the appropriate frequency ensures that algorithms have the context necessary to distinguish between normal workload spikes and genuine infrastructure anomalies.
Implementing this foundation requires a strategic understanding of hardware capabilities and network protocols. Organizations must evaluate their existing rack infrastructure to determine if current devices can support the data demands of modern analytics, or if a hardware refresh is necessary to unlock predictive insights.
Which PDU metrics matter most
For AI models to deliver actionable insights, teams must capture a comprehensive suite of electrical metrics beyond simple amperage. Critical parameters include Root Mean Square (RMS) Voltage (V), RMS Current (A), Active Power (kW), Apparent Power (kVA), Power Factor (PF), and cumulative Energy Consumption (kWh). Power Factor is particularly crucial in modern IT environments, as a degrading power factor can indicate failing server power supplies or harmonic distortion issues that threaten upstream infrastructure.
Polling frequency is equally critical. Traditional SNMP polling intervals of 5 to 15 minutes are insufficient for AI models designed to detect transient spikes or rapid thermal runaway. Modern analytics require streaming telemetry, utilizing protocols like MQTT or Redfish APIs to push data at 10-second or even 1-second intervals (1 Hz). This high-frequency data capture ensures that micro-events, which often serve as leading indicators for hardware failure, are successfully recorded and analyzed.
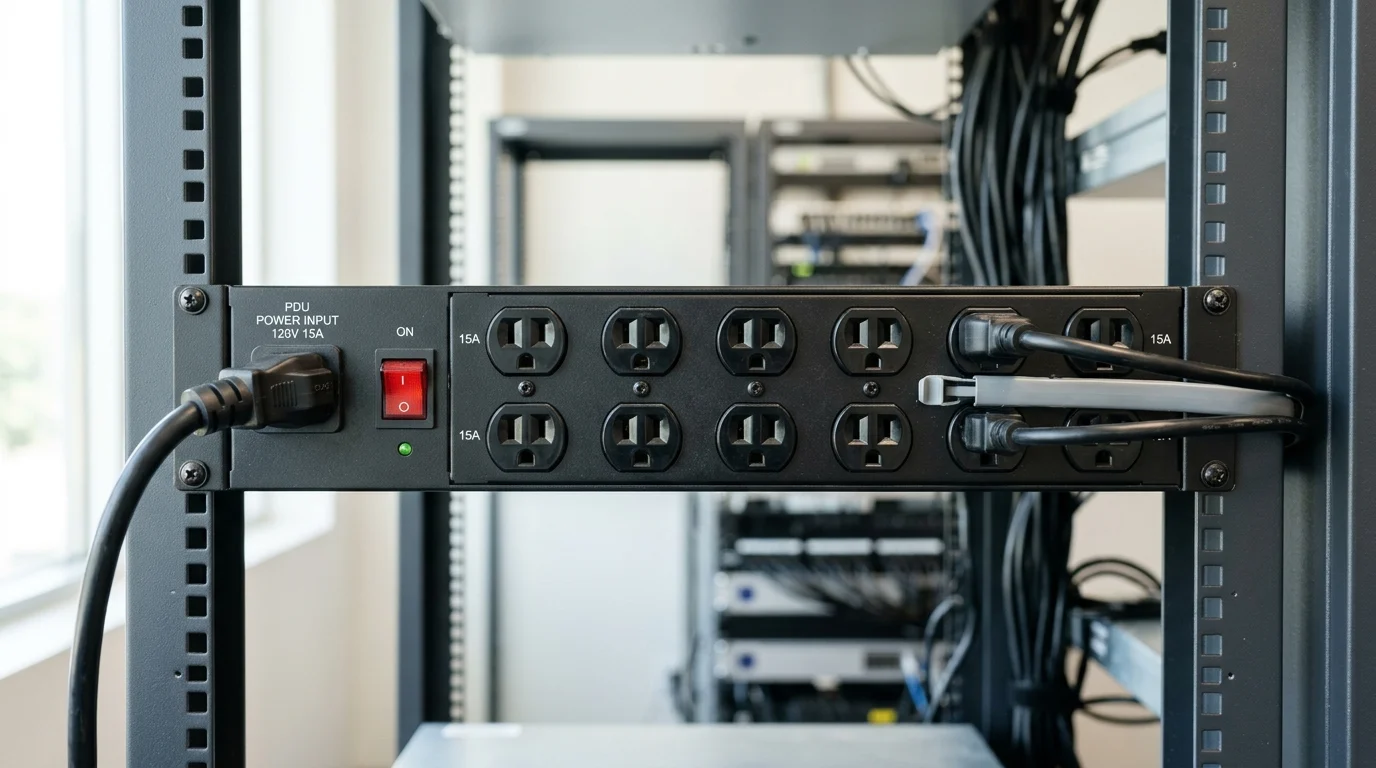
How intelligent rack PDUs compare with basic models
The depth of analytics achievable is fundamentally constrained by the hardware deployed at the rack level. A Basic PDU provides reliable power distribution but entirely lacks the network connectivity, embedded microprocessors, and metering capabilities required for data collection. These units represent a blind spot in the data center, rendering AI-driven power optimization impossible without the addition of cumbersome inline meters.
Conversely, an Intelligent PDU is engineered specifically for the data-driven facility. These devices feature hot-swappable network controllers, environmental sensor ports, and billing-grade metering accuracy (typically ±1%). This precision is non-negotiable for AI models calculating Power Usage Effectiveness (PUE) or allocating power costs across multitenant environments.
| Feature | Basic Models | Intelligent Models |
|---|---|---|
| Network Connectivity | None | Ethernet, Wi-Fi (optional) |
| Metering Accuracy | N/A | ±1% Billing Grade |
| Data Protocols | N/A | SNMPv3, RESTful API, MQTT, Redfish |
| Environmental Sensors | Unsupported | Supported (Temp, Humidity, Leak) |
| Typical Cost per Rack | $100 – $300 | $800 – $2,000+ |
Metered vs monitored vs switched PDUs
Within the category of smart power distribution, organizations must choose between metered, monitored, and switched architectures based on their specific analytic and operational requirements. Metered units provide local visual displays of power consumption, which is useful for technicians on the data center floor but insufficient for centralized AI ingestion unless equipped with network cards. Monitored units represent the baseline for analytics, continuously transmitting rack-level or outlet-level telemetry back to a central database.
Switched units offer the highest degree of control, combining outlet-level monitoring with remote relay capabilities. From an AI perspective, switched units enable automated remediation. If an analytics model detects a “zombie server”—a device consuming power while processing zero compute load—it can integrate with IT orchestration tools to safely shut down the specific outlet, autonomously reducing energy waste and cutting operational expenditures.
How AI models extract actionable insight from PDU data
Once a high-fidelity data pipeline is established, the focus shifts to the analytical models themselves. Extracting actionable insight from millions of data points requires deploying specific machine learning algorithms tailored to the unique physics of power distribution and thermal dynamics. The true value of these models is realized when they move beyond isolated power metrics and begin cross-correlating data across the entire facility ecosystem.
Which analytics use cases deliver the most value
The highest ROI in PDU analytics typically stems from predictive maintenance and capacity optimization. Predictive maintenance models utilize deep learning networks to analyze the harmonic profile and power draw consistency of individual receptacles. By identifying micro-fluctuations that indicate degrading capacitors in server power supplies, operators can replace components during scheduled maintenance windows, reducing unplanned IT downtime by up to 40%.
Capacity optimization algorithms deliver equally compelling returns by addressing the pervasive issue of zombie servers. Studies indicate that up to 25% of physical servers in enterprise data centers are comatose—consuming 60% of their peak power while delivering less than 5% CPU utilization. AI models analyze power draw patterns over 30- to 90-day rolling windows to identify these stranded assets, allowing IT teams to decommission hardware, reclaim kW capacity, and defer millions of dollars in new facility construction.
How to correlate PDU telemetry with cooling and IT systems
Power consumption does not exist in a vacuum; it is inextricably linked to thermal output. Advanced AI models achieve breakthrough efficiencies by correlating rack-level power telemetry with data from Computer Room Air Conditioning (CRAC) units, chillers, and containment sensors. By understanding the exact power load—and therefore the heat load—generated by specific racks in real-time, AI controllers can dynamically adjust cooling outputs with surgical precision.
This correlation enables facilities to safely elevate ambient temperatures within ASHRAE guidelines. For every 1°C increase in baseline cooling setpoints, data centers typically realize a 4% to 5% reduction in cooling energy costs. AI ensures this is done without risking thermal runaway, as the models continuously verify that the power draw at the receptacle level remains stable despite the warmer inlet temperatures.
Edge vs cloud analytics trade-offs
Architecting the AI inference engine requires navigating the trade-offs between edge and cloud computing. Processing telemetry from 10,000 intelligent PDUs at 1 Hz generates massive bandwidth requirements and introduces latency if all raw data is transmitted to a centralized cloud. Edge analytics solves this by deploying lightweight machine learning models directly on localized facility gateways or within the embedded controllers of the units themselves, achieving sub-50ms latency for critical threshold alerts and automated breaker trips.
However, cloud computing remains essential for training complex models and conducting long-term trend analysis. The optimal architecture is typically a hybrid approach: edge devices filter the telemetry, executing immediate localized actions and transmitting only aggregated summaries and anomalous event data to the cloud. This reduces bandwidth consumption by up to 90% while ensuring the cloud-based deep learning models have the historical data necessary to refine their predictive algorithms over time.
How to implement AI-powered PDU analytics
Deploying an AI-powered analytics architecture requires rigorous execution across IT, networking, and facility management domains. The transition from legacy infrastructure to a predictive, data-driven environment cannot be achieved through a simple software installation. It demands a carefully orchestrated pipeline that ensures data integrity, adheres to strict security frameworks, and proves financial viability through measurable milestones.
How to build a practical data pipeline
Building a practical data pipeline begins with standardizing the ingestion protocols. Facilities should prioritize modern, lightweight protocols such as MQTT or the DMTF Redfish API, which are designed specifically for high-frequency IoT telemetry, over legacy SNMPv1/v2c. The pipeline architecture must be capable of ingesting and normalizing upwards of 100,000 data points per second in a mid-sized facility without introducing processing bottlenecks.
Once ingested, this time-series data must be routed to a specialized database optimized for high write loads, such as InfluxDB or Prometheus. Traditional relational databases will rapidly degrade under the continuous write pressure of 1 Hz telemetry. A robust data lake architecture ensures that both the real-time stream processing engines (for immediate alerting) and the batch processing AI models (for historical trend analysis) can query the data simultaneously without latency.
Cybersecurity, interoperability, and compliance requirements
Integrating industrial control systems with AI networks expands the facility’s attack surface, making cybersecurity paramount. Every pdu power distribution unit connected to the network must be treated as a potential vector for intrusion. Implementations must mandate TLS 1.2 or 1.3 encryption for all telemetry data in transit, alongside strict role-based access controls (RBAC) and disabled legacy protocols (like Telnet or HTTP) at the hardware level.
Interoperability and compliance further dictate the deployment framework. Organizations should ensure their chosen architecture aligns with the IEC 62443 standard for industrial automation and control systems security. Furthermore, firmware lifecycle management must be automated; the ability to push secure, cryptographically signed firmware updates to thousands of rack units simultaneously is a mandatory requirement for maintaining compliance with ISO 27001 and regional data protection regulations.
How to plan a phased rollout and measure ROI
To mitigate operational risk, organizations should avoid “big bang” deployments in favor of phased rollouts. A standard implementation should begin with a pilot phase targeting 50 to 100 high-density racks. This controlled environment allows data science teams to tune the machine learning algorithms, calibrate anomaly detection sensitivities, and validate the data pipeline’s stability under real-world conditions before facility-wide scaling.
Measuring ROI during this pilot phase is critical for securing executive sponsorship for broader deployment. Key performance indicators should include quantifiable reductions in Power Usage Effectiveness (PUE), the exact kW volume of reclaimed stranded capacity, and the reduction in mean time to resolution (MTTR) for power-related incidents. Reclaiming just 500 kW of stranded power through AI optimization can effectively avoid $5 million in new infrastructure build costs, assuming a conservative capital expansion rate of $10 per watt.
How to evaluate vendors for AI-powered PDU analytics
The success of an AI-driven power strategy relies heavily on the vendor ecosystem selected to provide the hardware, middleware, and analytics platforms. Because intelligent power infrastructure has a typical lifecycle of 5 to 7 years, operators must evaluate vendors not just on current specifications, but on their commitment to ongoing software development, API openness, and hardware modularity. A rigorous evaluation framework ensures alignment between facility constraints and long-term IT objectives.
Technical and commercial selection criteria
When assessing potential vendors, technical criteria must prioritize open architectures and modularity. Proprietary closed-loop systems that force facilities into a single vendor’s software ecosystem severely limit the flexibility needed for future AI integrations. Vendors must provide comprehensive, well-documented RESTful APIs and pre-built integrations for major Data Center Infrastructure Management (DCIM) and IT Service Management (ITSM) platforms. Hardware modularity, such as hot-swappable network controllers, is also vital, allowing facilities to upgrade computational and networking capabilities without dropping power to critical IT loads.
Commercial criteria should evaluate the vendor’s enterprise support structures, supply chain resilience, and service level agreements for firmware patching.
| Evaluation Criteria | Weight | Target Specification / Requirement |
|---|---|---|
| API & Integration | 30% | Fully documented REST/Redfish API, MQTT support |
| Hardware Modularity | 25% | Hot-swappable controllers, high-retention outlets |
| Metering Precision | 20% | ±1% accuracy across V, A, kW, kWh, PF |
| Security Standards | 15% | IEC 62443 alignment, SNMPv3, TLS 1.3 |
| Vendor Support | 10% | 24/7 SLA, automated firmware vulnerability patching |
How to assess total cost of ownership and expected returns
Assessing the Total Cost of Ownership (TCO) for AI-powered analytics requires calculating both the initial capital expenditure (CapEx) for intelligent hardware and the ongoing operational expenditure (OpEx) for software licensing and data storage. Upgrading to high-density intelligent power strips represents a significant CapEx investment—often scaling past $1,500 per rack for advanced switched models. Additionally, cloud-based AI analytics platforms typically operate on a SaaS model, adding an OpEx burden ranging from $50 to $150 per rack, per year.
Despite these costs, a comprehensive TCO analysis must model the financial returns generated by the system. When accounting for the deferral of physical facility expansion, the reduction in cooling costs via dynamic thermal management, and the minimization of SLA penalties due to unplanned downtime, the payback period for a fully deployed AI power analytics system is typically between 18 and 24 months. By treating power telemetry as a strategic asset rather than a facility byproduct, organizations can fundamentally alter the cost dynamics of their data center operations.
Key Takeaways
- The most important conclusions and rationale for pdu power distribution unit
- Specs, compliance, and risk checks worth validating before you commit
- Practical next steps and caveats readers can apply immediately
Frequently Asked Questions
What PDU data is most useful for AI-powered analytics?
Capture RMS voltage, RMS current, active power, apparent power, power factor, and kWh. Polling at about one second or less gives AI enough detail to spot overload trends and abnormal behavior.
How can AI analytics help prevent PDU overloads?
AI learns normal rack and outlet power patterns, then flags deviations before circuits reach dangerous levels. This helps teams rebalance loads, migrate workloads, or replace failing equipment early.
Why is outlet-level telemetry important in a rack PDU?
Outlet-level data shows exactly which devices are driving spikes, imbalance, or wasted capacity. That makes troubleshooting faster and supports safer capacity planning in high-density racks.
Can AI-powered PDU monitoring improve data center efficiency?
Yes. It helps identify stranded capacity, reduce false alarms, and optimize power usage without immediate upstream upgrades. Many teams use it to delay capital spending while maintaining SLA performance.
When should a facility upgrade to intelligent PDUs for analytics?
Upgrade when you need real-time monitoring, high-density rack support, or predictive maintenance insights. If current PDUs only provide basic metering, they may not supply the granular data AI models require.
Post time: Jun-01-2026