

What a Metered PDU Actually Measures
A metered PDU measures electrical parameters at one or more points inside the PDU. The basic set of measurements is current (amperes), voltage (volts), and power (watts or kilowatts). The advanced set adds energy (kilowatt-hours), power factor, frequency, and demand (peak power over a rolling interval). The measurements can be at the PDU inlet (one value per PDU) or at each circuit breaker branch (one value per branch, typically 6 to 24 branches per PDU).
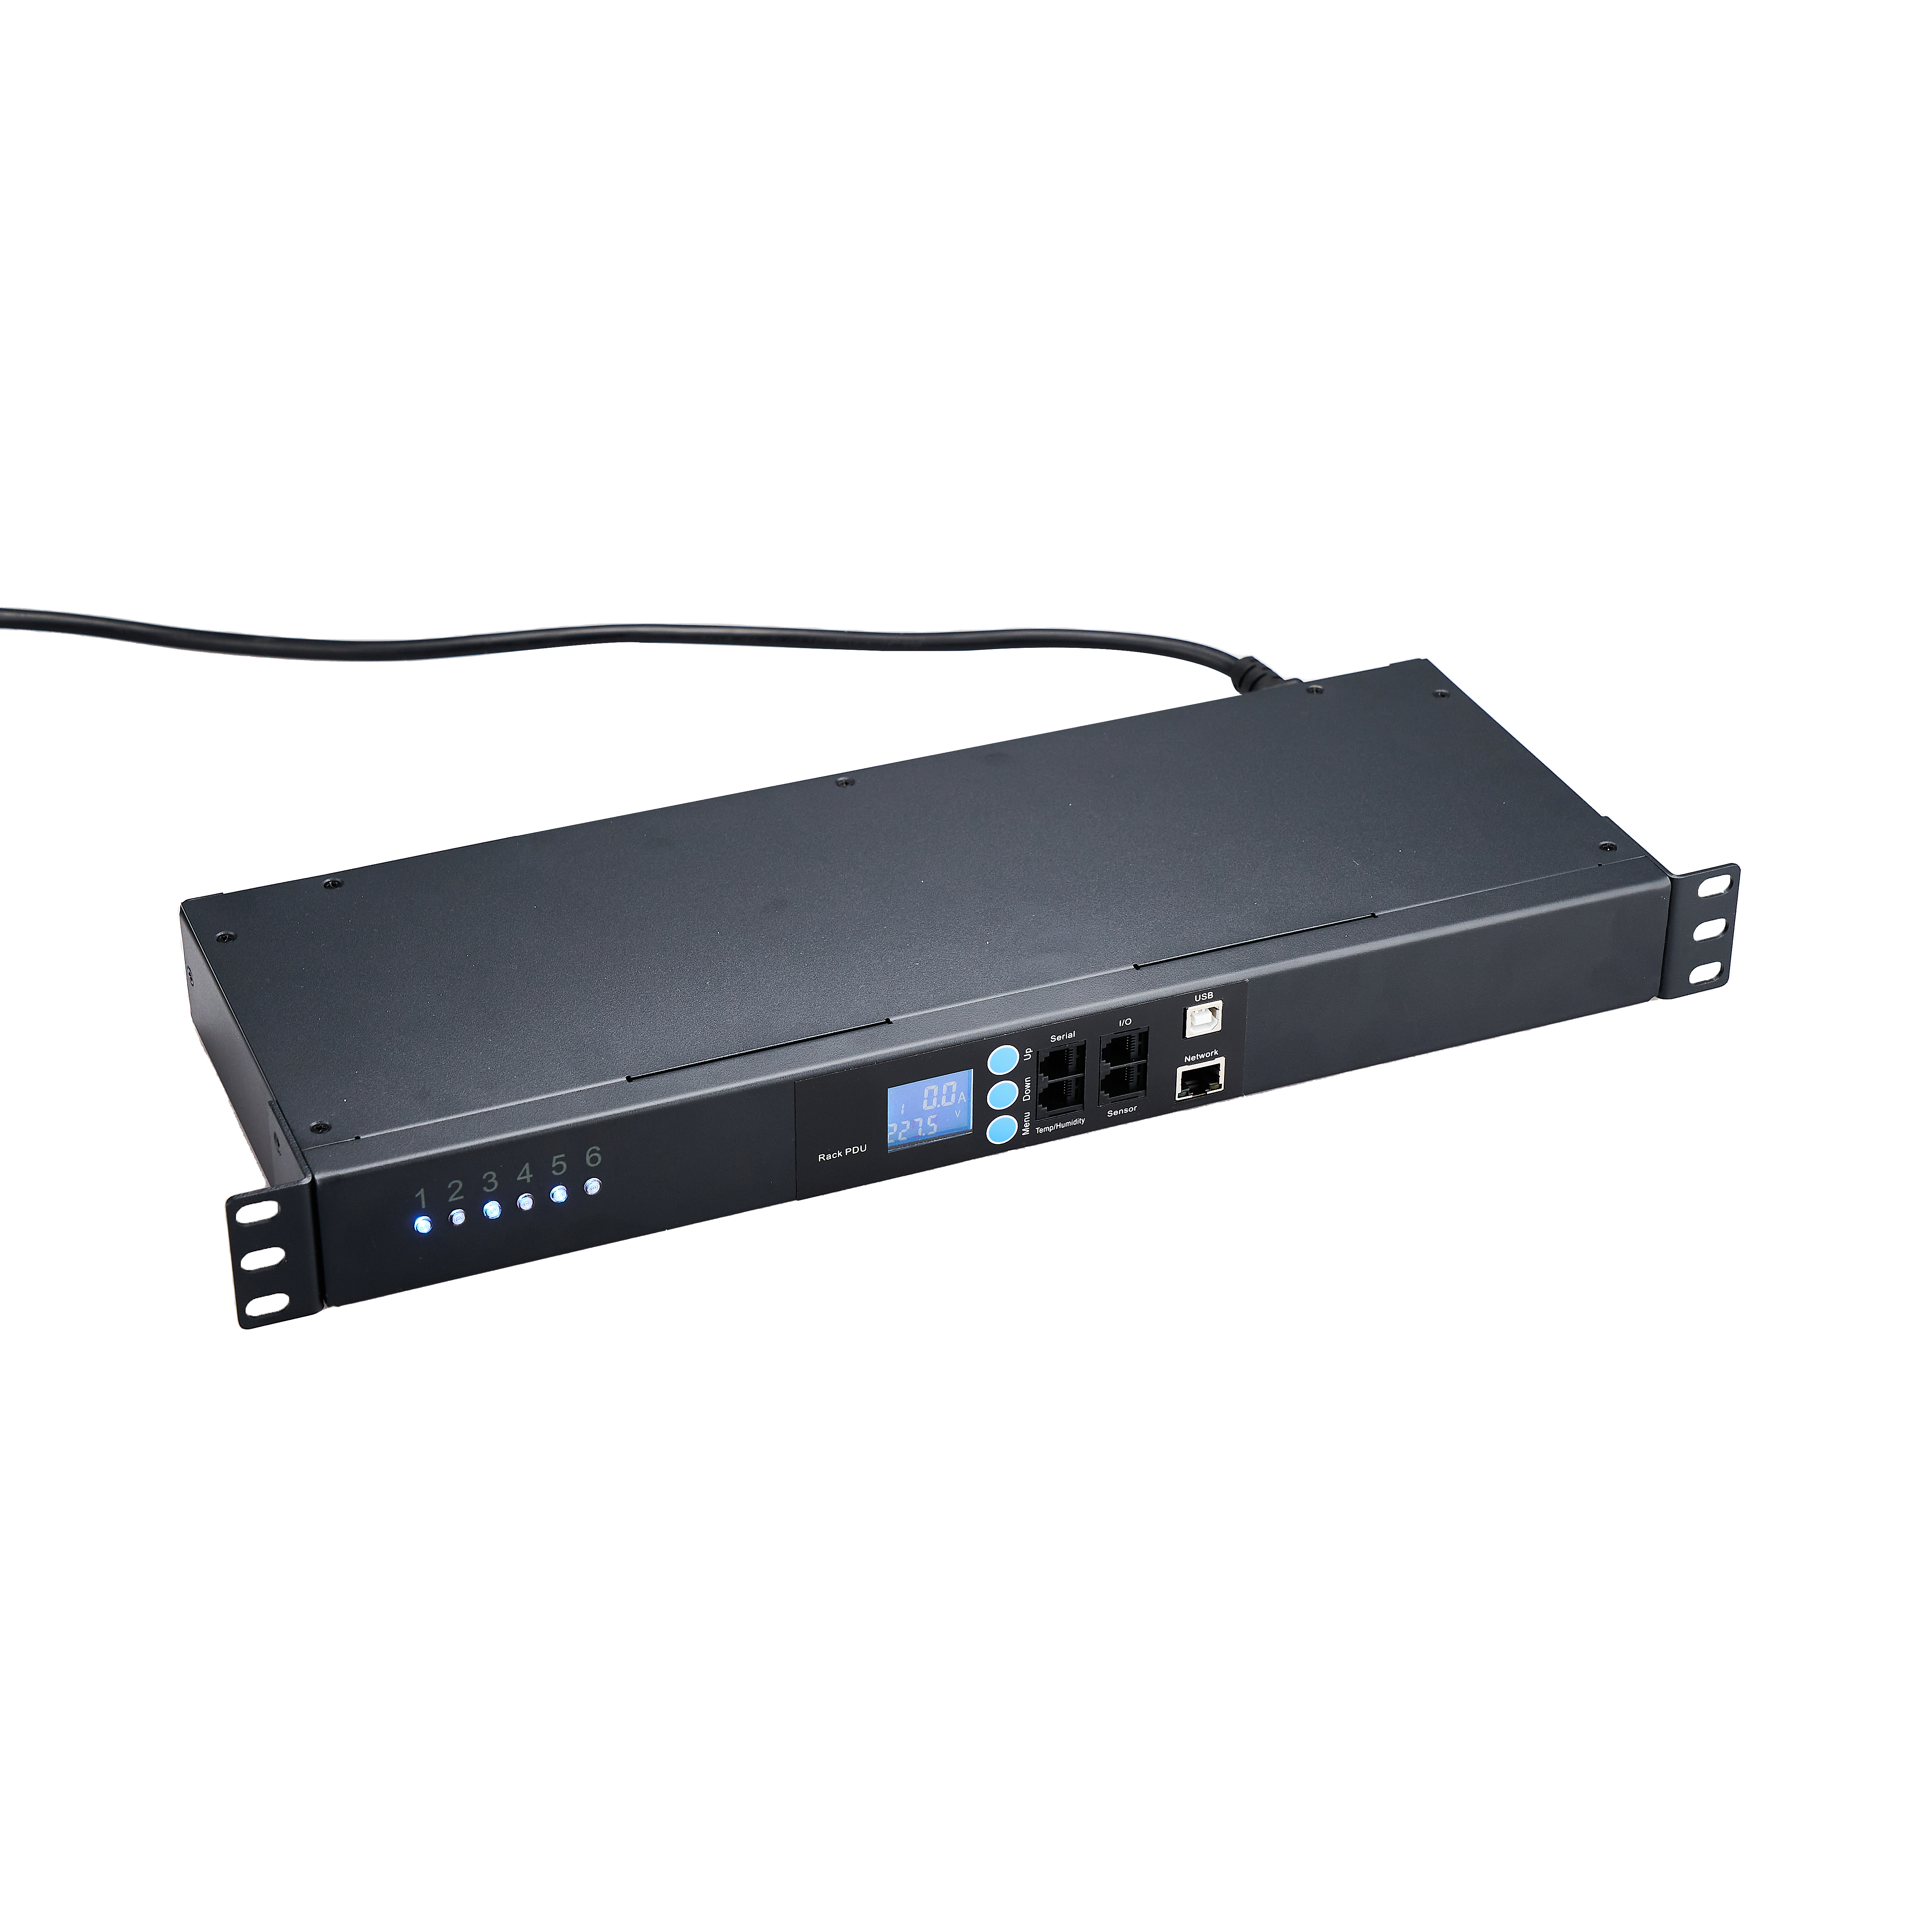
The measurement hardware is built around current transformers (CTs) that clamp around each conductor. Voltage is measured at the PDU bus bars. The measurements are displayed locally on an OLED or LCD readout and can also be transmitted over a network for remote monitoring.
Basic vs Metered vs Monitored vs Switched: A Capability Tier Map
The rack PDU market uses four tiers to differentiate capability: basic, metered, monitored, and switched. The tiers are not standardized by any single body, but the four-tier map is the de facto framework that PDU manufacturers, data center operators, and procurement teams use. Understanding the map is the foundation for the ROI calculation.
| Tier | Capabilities | Typical Price Premium | Common Use Case |
|---|---|---|---|
| Basic | Power distribution only; no measurements | Baseline (1x) | Non-critical, low-density, small deployments |
| Metered | Local display of current, voltage, kW, kWh | +1.2x to 1.5x | Capacity planning, ASHRAE TC 9.9 compliance |
| Monitored | Metered + remote network access via SNMP/Modbus/REST | +1.5x to 2.0x | DCIM integration, multi-site management |
| Switched | Monitored + remote outlet switching | +2.0x to 3.0x | Remote power cycling, sequenced startup, security |
The price premiums are relative to the basic tier for a 24-outlet, 208V, 30A platform. Basic is for non-critical deployments; metered adds local display; monitored adds remote network access; switched adds outlet switching. For most data centers, metered or monitored is the right answer.
The ROI Formula: When Does Basic Monitoring Pay for Itself?
The ROI of upgrading from basic to metered PDU is driven by three avoided costs: stranded capacity, peak demand charges, and compliance gaps. The metered PDU enables right-sizing of UPS and feeder capacity, which avoids the stranded capacity that basic PDUs require as a planning buffer. The metered PDU also enables peak demand management, which can reduce the demand charges that utilities impose on data center customers. For certified data centers, the metered PDU avoids the compliance gap that basic PDUs create under ASHRAE TC 9.9 or Uptime Institute Tier III/IV.
The example calculation is representative of a typical mid-density data center rack with moderate power cost. Payback is approximately 11 months. For higher-density racks (10 to 15 kW), payback is shorter (6 to 9 months). The stranded capacity savings are the largest ROI component; the demand charge reduction is the second-largest; the compliance cost avoidance is the third.
Payback Period Calculation: A Worked Example
The worked example below walks through a realistic payback calculation for a 10-rack data center deployment. The example uses representative industry averages for power cost, demand charge, and equipment refresh cycle. The numbers are intended to be illustrative; actual results depend on the specific data center electrical design and the local utility tariff.
The worked example shows a payback period of approximately 4 months for a 10-rack deployment. The payback shortens for larger deployments because the metering premium is per-PDU but the avoided stranded capacity scales with the number of racks. For a 100-rack deployment, the payback period is typically 2 to 4 months. For a single-rack deployment, the payback period is typically 12 to 24 months because the fixed cost of the metered PDU upgrade is not amortized across multiple racks.
The example also shows a positive NPV over a 5-year refresh cycle, which is the standard data center equipment refresh horizon. The metered PDU investment pays for itself many times over the equipment life, which is the basis for the procurement recommendation. The recommendation is strongest for deployments above 5 racks and weakest for single-rack or two-rack deployments.
Threshold Triggers: When a Non-Metered PDU Costs You Money
There are four threshold triggers that turn a non-metered PDU into a money-losing proposition. The triggers are operational events that, once they happen, expose the gap between the actual load and the planning buffer. The triggers are the basis for the “when does basic monitoring pay for itself” question in the article title.
Trigger 1: The breaker trips unexpectedly. A non-metered PDU does not reveal which branch is approaching the breaker limit. When the breaker trips, the operator has no data to identify the cause. The mitigation is either to reduce the load on the affected branch (which requires knowing which outlets are on which branch) or to redistribute the load across PDUs. A metered PDU shows the per-branch load in real time and prevents the trip by alerting the operator before the breaker opens.
Trigger 2: The utility demand charge spikes. A non-metered PDU does not reveal when the data center approaches a peak demand window. The utility tariff charges per kW of peak demand, so a momentary spike from a batch job or a sequential startup can increase the demand charge for the entire month. A metered PDU reveals the demand in real time and enables peak-shaving to avoid the spike.
Trigger 3: The UPS or feeder is undersized. A non-metered PDU does not reveal the actual load on the UPS or feeder, which means the operator must provision a planning buffer to account for unknown future load. The buffer is typically 30 to 50 percent of the rated capacity. A metered PDU reveals the actual load and allows the operator to provision tighter, which delays or avoids the UPS upgrade.
Trigger 4: The ASHRAE TC 9.9 or Uptime Institute audit arrives. A non-metered PDU does not provide the per-rack power measurement that ASHRAE TC 9.9 recommends or that Uptime Institute Tier III/IV requires. The operator must either retrofit the PDUs with external metering (which is typically more expensive than the metered PDU premium) or fail the audit and remediate. A metered PDU satisfies the audit requirement out of the box.
The four triggers are independent but related. Trigger 1 and Trigger 2 are operational events that occur routinely in any data center. Trigger 3 is a capacity planning event that occurs every 2 to 3 years as the data center load grows. Trigger 4 is a compliance event that occurs every 3 to 5 years as the data center pursues certification renewal. The metered PDU addresses all four triggers and provides a positive ROI over the equipment refresh cycle.
ASHRAE TC 9.9 and Uptime Institute Tier: The Compliance Lens
ASHRAE TC 9.9 is the data center thermal guidelines technical committee within ASHRAE (the American Society of Heating, Refrigerating and Air-Conditioning Engineers). The TC 9.9 guidelines, published in the 2022 fifth edition of “Thermal Guidelines for Data Processing Environments,” define the recommended and allowable operating envelopes for data centers in terms of temperature, humidity, and airflow. Per-rack power measurement is a foundational input to the operating envelope, which is why metered PDUs are the practical minimum for ASHRAE TC 9.9 reporting.
The recommended envelope balances equipment reliability against cooling energy consumption; per-rack power measurement is required to confirm operation within it. The allowable envelope supports wider temperature and humidity ranges; branch-level metering is required to fully exploit it.
Uptime Institute Tier III requires per-rack power measurement for N+1 redundancy analysis; Tier IV requires it for 2N redundancy analysis. The procurement recommendation for Tier-certified data centers is to specify metered PDUs across the entire installation.
Metering Accuracy Classes: kWh vs kVA vs Branch-Level
Metering accuracy is the specification that determines how close the measured value is to the true value. The specification is typically expressed as a percentage of full scale (FS) or as a percentage of the reading (RDG). For rack PDU applications, the typical accuracy specification is plus or minus 1 to 3 percent of full scale, which is acceptable for capacity planning but not for revenue-grade billing applications.
| Accuracy Class | Typical Specification | Use Case | Cost Premium |
|---|---|---|---|
| Standard rack PDU metering | +/- 1-3% of full scale | Capacity planning, ASHRAE TC 9.9 reporting | Baseline (1x) |
| High-accuracy rack PDU metering | +/- 0.5% of full scale | Tenant billing, departmental cost allocation | +1.5x to 2x |
| Revenue-grade metering (ANSI C12.20) | +/- 0.2% of reading | Utility billing, ISO compliance | +3x to 5x |
Standard rack PDU metering is the typical specification for metered PDUs in the Newsunn product line. The 1 to 3 percent of full scale accuracy is acceptable for capacity planning, ASHRAE TC 9.9 reporting, and DCIM dashboards. The accuracy is not sufficient for utility billing or for ISO compliance, which require revenue-grade metering.
High-accuracy rack PDU metering is the next tier, with 0.5 percent of full scale accuracy. This tier is appropriate for tenant billing and departmental cost allocation where the customer requires accurate per-rack or per-branch measurements. The cost premium is 1.5x to 2x the standard metering cost.
Revenue-grade metering per ANSI C12.20 is the highest tier, with 0.2 percent of reading accuracy. This tier is required for utility billing or for ISO compliance in jurisdictions where the data center sells power to tenants atrevenue-grade metering per ANSI C12.20 is the highest tier, with 0.2 percent of reading accuracy. This tier is required for utility billing or for ISO compliance in jurisdictions where the data center sells power to tenants at metered rates. Revenue-grade metering is rarely integrated into rack PDUs and is more commonly deployed as a separate revenue-grade meter upstream of the PDU.
For most data center procurement scenarios, the standard rack PDU metering tier is the right answer. The 1 to 3 percent of full scale accuracy is acceptable for the decisions the operator needs to make: capacity planning, compliance reporting, and DCIM dashboarding. The higher-accuracy tiers are specialized options for billing or regulatory applications.
Integration with DCIM and BMS Platforms
DCIM (Data Center Infrastructure Management) and BMS (Building Management System) platforms aggregate per-rack power data from metered PDUs into a single dashboard. The integration is the practical payoff of the monitored PDU tier: the operator can see the entire data center from a single screen rather than walking from rack to rack to read local displays. The integration protocols are standardized, which means the metered PDU from one manufacturer can integrate with the DCIM platform from another manufacturer.
The most common integration protocol is SNMP (Simple Network Management Protocol), which is supported by virtually every networked PDU. SNMP v2c is the legacy version and is widely supported; SNMP v3 is the current version and adds authentication and encryption. The PDU exposes a set of MIBs (Management Information Bases) that define the per-rack and per-branch measurements. The DCIM platform polls the PDUs via SNMP and aggregates the data into the dashboard.
Modbus TCP is the second most common protocol, particularly in industrial and BMS integrations. Modbus is a register-based protocol that is more efficient than SNMP for high-frequency polling. Many BMS platforms prefer Modbus for power meter integration, which is why metered PDUs typically support both SNMP and Modbus in parallel.
REST APIs are the third common protocol, particularly in modern DCIM platforms. The Newsunn intelligent PDU and switched metered PDU lines support REST alongside SNMP and Modbus, which allows integration with both legacy and modern DCIM platforms. The integration typically takes 5 to 10 minutes per PDU and does not require custom software development.
Cost Stack: Metered vs Basic PDU Pricing
The cost stack for metered vs basic PDU includes the hardware premium, the network infrastructure (for monitored PDUs), and the DCIM integration (for centralized monitoring). The stack is the basis for the procurement decision because the per-PDU cost difference is small relative to the per-rack operational cost.
The cost stack shows that the metered tier adds USD 250 to the total cost of ownership over a 5-year refresh cycle. The monitored tier adds USD 470, and the switched tier adds USD 770. The avoided operational cost (stranded capacity, demand charges, compliance) typically exceeds the premium by a factor of 3 to 10 over the same 5-year cycle, which is the basis for the positive ROI calculation.
The network infrastructure cost is typically the lowest-cost item in the stack but is sometimes overlooked for retrofit installations. The DCIM integration cost depends on the platform license model; procurement teams should confirm the model before specifying the PDU tier.
Next Steps and Frequently Asked Questions
For procurement teams evaluating the upgrade from basic to metered PDU, the practical first move is to gather the local utility tariff, the existing rack load profile, and the certification requirements (ASHRAE TC 9.9, Uptime Institute Tier). The three inputs feed into the ROI formula and produce the payback period. The Newsunn export team can align the metered or monitored PDU configuration with the data center electrical design through the metered and monitored PDUs configuration tool, and the switched metered rack PDU product reference provides the architecture for inlet-plus-branch metering.
What is the difference between a metered and a monitored PDU?
A metered PDU measures and displays electrical parameters such as voltage, current, power (kW), and energy (kWh) at the PDU input or at the branch level. A monitored PDU adds remote monitoring capability via a network interface, typically Ethernet, allowing the same parameters to be viewed from a DCIM platform or a web browser. Some vendors use the terms interchangeably; the cleaner distinction is that metered is local display and monitored is remote access, with most modern ‘metered PDUs’ offering both.
How accurate is a metered PDU?
Most metered PDUs use current transformers (CTs) with a measurement accuracy of plus or minus 1 to 3 percent of the reading at full scale. The accuracy is typically specified by the PDU manufacturer as a percentage of full scale, not of the reading, which means the absolute error is largest at low load. For a 30A branch circuit, a 1 percent of full scale specification translates to plus or minus 0.3A of error, which is acceptable for capacity planning but not for revenue-grade billing applications.
What is the payback period for a metered PDU compared to a basic PDU?
The payback period for a metered PDU compared to a basic PDU depends on the avoided cost of capacity headroom that metering enables. A metered PDU typically costs USD 200 to USD 500 more than a basic PDU with the same outlet count and plug type. The avoided cost comes from being able to right-size the PDU to the actual load with a smaller capacity headroom buffer, which can save USD 100 to USD 300 per PDU per year in avoided stranded capacity. Payback periods typically range from 6 to 24 months depending on the data center power cost, the rack power density, and the existing capacity planning practices.
Does a metered PDU help with ASHRAE TC 9.9 compliance?
Yes. ASHRAE TC 9.9 (the data center thermal guidelines committee) recommends per-rack power measurement as a foundational element of the recommended and allowable operating envelopes. A metered PDU provides the per-rack kW measurement that ASHRAE TC 9.9 requires for the recommended envelope, and branch-level metering is required for the more granular thermal analysis that the allowable envelope supports. For Uptime Institute Tier certification, Tier III and Tier IV data centers require per-rack power measurement, which makes metered PDUs a practical baseline rather than a premium option.
Can a metered PDU integrate with DCIM platforms?
Yes. Most metered PDUs integrate with major DCIM platforms via standard protocols including SNMP v2c / v3, Modbus TCP, and REST APIs. The integration allows the DCIM platform to aggregate per-rack power data into a single dashboard, set threshold alarms for high or low load conditions, and produce the reports that ASHRAE TC 9.9, Uptime Institute, or internal sustainability reporting require. The Newsunn intelligent PDU and switched metered PDU lines support the standard protocols and can integrate with Schneider StruxureWare, Vertiv Trellis, and the major open-source DCIM platforms.
What is branch-level metering versus inlet-level metering?
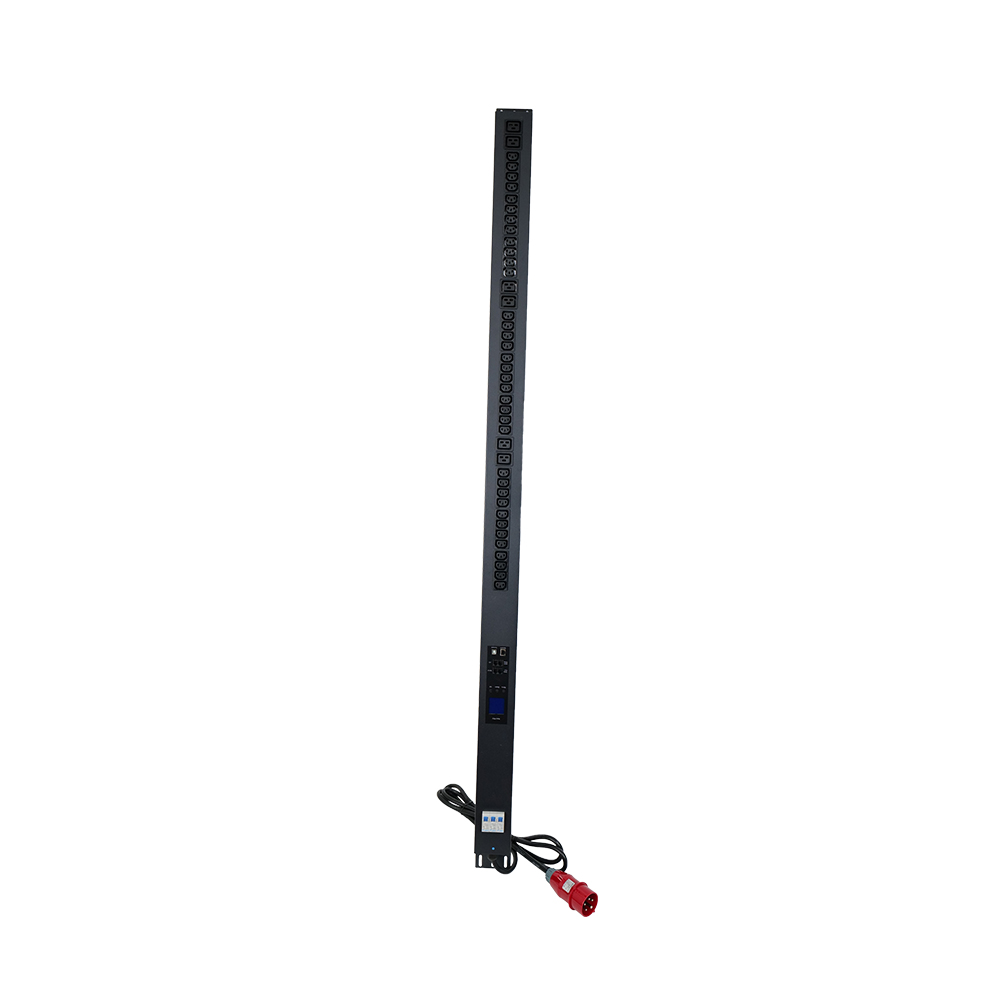
Inlet-level metering measures the total current, voltage, and power at the PDU input, which gives a single value per PDU. Branch-level metering measures the current and power at each circuit breaker branch within the PDU, which gives multiple values per PDU (typically 6 to 24 branches). Branch-level metering is more expensive because it requires a CT on each branch, but it provides the granular data needed to identify which outlets are heavily loaded and which have unused capacity.
What does a switched metered PDU add over a metered PDU?
A switched metered PDU adds remote outlet switching on top of the metering capability. Each outlet can be turned on, off, or power-cycled via the network interface. The switching capability is used for remote power cycling of hung servers, for sequenced startup of equipment to avoid inrush current spikes, and for remote lockdown of unused outlets as a security measure. A switched metered PDU typically costs USD 300 to USD 600 more than a non-switched metered PDU with the same outlet count.
How does metered PDU data feed into PUE calculation?
PUE (Power Usage Effectiveness) is calculated as total facility power divided by IT equipment power. The IT equipment power is the sum of the per-rack power measurements from metered PDUs. A data center with 100 racks, each metered at an average of 4 kW, has IT equipment power of 400 kW; if the total facility power is 600 kW, the PUE is 1.50. Metering accuracy directly affects the PUE calculation accuracy: a 1 percent of full scale metering error on 30A branches introduces approximately 0.3A of uncertainty per branch, which becomes 30A across 100 racks.
With over a decade of hands-on experience in PDU design and manufacturing, Newsunn’s technical team provides in-depth insights into power distribution solutions for data centers, server rooms, and mission-critical facilities. Backed by 8 R&D engineers and a 30,000 m² production base, we help global clients source the right PDU products — from standard rack units to fully customized intelligent power distribution systems.
Post time: Aug-11-2026